Bathroom remodeling industry growth in 2026–2027 is a share story, not a volume story. Total U.S. home improvement spending is nearly flat, growing slower than inflation, yet bathrooms are the single most common project professional remodelers take on, and pro-led kitchen and bath work is outgrowing DIY by a wide margin. Contractors who grow over the next 18 months will do it by taking a bigger slice of a stable pie, not by waiting for the pie to expand.
This report pulls together the latest data from Harvard’s Joint Center for Housing Studies, NAHB, NKBA, Houzz, and the Cost vs. Value Report, then turns it into a practical growth plan for bathroom remodeling businesses.
Key Takeaways
- The overall market is flat. Harvard’s LIRA projects owner-occupied remodeling spending of about $519 billion by mid-2027, with annual growth slowing to roughly 0.5%.
- Bathrooms lead project volume. 73% of NAHB remodelers rated bathroom remodels common or very common in 2025, the top project type.
- Pros are winning share from DIY. NKBA forecasts professional kitchen and bath renovation spending up 4.4% in 2026 versus 0.6% for DIY.
- Tickets are rising. Houzz found median primary bath spend up 15.4% to $15,000 and guest bath spend up 16.7% to $7,000.
- Aging in place is now mainstream scope. Grab bars, nonslip floors, low-curb showers, and bigger showers are standard requests, not niche add-ons.
- Labor, not demand, is the binding constraint. Growth goes to firms that can staff, schedule, and price for it.
What “Bathroom Remodeling Industry Growth” Actually Means Right Now
Industry growth gets reported three different ways, and mixing them up leads to bad business decisions. Before you plan hiring or marketing spend, separate these three numbers.
- Nominal spending growth: total dollars spent, including price inflation.
- Real (inflation-adjusted) activity: the actual volume of work being done.
- Share shift: which project types and which providers (pro vs. DIY) are capturing those dollars.
In 2026, nominal spending is creeping up, real activity is roughly flat, and the share shift is strongly in favor of professionally installed bathrooms. That third number is the one that matters most to a bath contractor.
The Macro Picture: A Flat Market With a Rising Floor
Total Remodeling Spending (Harvard JCHS LIRA)
The July 2026 Leading Indicator of Remodeling Activity projects annual improvement and repair spending on owner-occupied homes rising only from $517 billion in Q2 2026 to $519 billion in Q2 2027. Annual growth is expected to slow from 2.1% in Q3 2026 to 0.5% by Q2 2027.
Harvard’s researchers point to flattening remodeling permits and building-product sales, plus weak housing starts and economic uncertainty. The next LIRA update is scheduled for October 22, 2026, so check whether this trajectory holds.
Kitchen and Bath Spending (NKBA)
NKBA’s 2026 Kitchen & Bath Industry Outlook sizes the U.S. kitchen and bath market at about $228 billion, essentially flat year over year. Underneath that flat total, the mix is moving fast:
- Repair and remodel K&B spending: +2.9%
- New-construction K&B spending: −3.0%
- Professional K&B renovations: +4.4%
- DIY K&B renovations: +0.6%
NKBA’s mid-year update held the total near $228 billion but noted that higher prices, not more projects, are doing much of the lifting. For contractors, that means revenue can look healthy while job counts stall.
Residential Remodeling Outlook (NAHB)
NAHB is slightly more optimistic, forecasting residential remodeling up 3% in 2026 and 2% in 2027 in inflation-adjusted terms. It also reports 128,000 remodeling firms at the start of 2025, up from 69,000 in 2000.
That firm count is a warning as much as a signal. Nearly twice as many companies are competing for a market that is growing slowly.
| Indicator | Latest Reading | What It Tells a Bath Contractor |
|---|---|---|
| Harvard LIRA (total remodeling) | $517B → $519B (Q2 2026–Q2 2027) | Overall demand is flat; growth must come from share. |
| NKBA K&B market | ~$228B; pro-led +4.4%, DIY +0.6% | Homeowners are hiring out more of the work. |
| NAHB remodeling forecast | +3% (2026), +2% (2027), real | Modest real growth, concentrated in existing homes. |
| NAHB Remodeling Market Index | 61 (Q2 2026) | Remodelers still rate conditions positive (above 50), but softening. |
| Median owner-occupied home age | 42 years (2024 ACS) | A permanent, rising pipeline of worn-out bathrooms. |
Why Bathrooms Are Outperforming the Rest of Remodeling
Bathrooms Are the Most Common Remodeling Job
In NAHB’s Q4 2025 survey, bathroom remodeling was the most common project, averaging 4.1 on a 5-point scale. 73% of remodelers rated it common or very common, ahead of kitchens (3.9) and whole-house remodels (3.5).
Bathrooms win on frequency because they fail faster than most rooms. Water, heavy daily use, and code-driven upgrades (ventilation, GFCI, waterproofing) push them into replacement cycles sooner.
The Housing Stock Is Aging Into Prime Remodel Years
NAHB’s analysis of the American Community Survey puts the median age of owner-occupied homes at 42 years, up from 31 in 2005. About 47% of owner-occupied homes were built before 1980.
Age varies sharply by state. New York’s median is 64 years, while Nevada’s is 25 and Texas’s is 28. Older Northeast and Midwest markets have deeper replacement demand; Sun Belt markets have more first-time remodels of 1990s and 2000s builder-grade baths.
Homeowners Are Spending More Per Bathroom
The 2026 U.S. Houzz & Home Study of more than 20,000 homeowners found guest bathrooms (25%) and primary bathrooms (23%) right behind kitchens (26%) as the most renovated rooms. Median spend rose to $15,000 for primary baths and $7,000 for guest baths.
The same study shows planned 2026 median spending for all renovations at $15,000, down 25% from the prior year. Read together, homeowners are being more selective about projects, but bathrooms keep making the cut.
Aging in Place Has Moved From Niche to Default
Houzz’s 2026 Bathroom Trends Study found more than 7 in 10 renovating homeowners are addressing special needs, and more than half of those needs are five or more years away. Among aging-in-place upgrades, 63% add grab bars, 56% add nonslip flooring, and 55% install low-curb showers.
Shower enlargement jumped to 49% of renovating homeowners, up 10 points in a year. NKBA’s 2026 Bath Trends Report adds that 32% of design pros consider aging-in-place design already mainstream and another 48% say it is approaching mainstream.
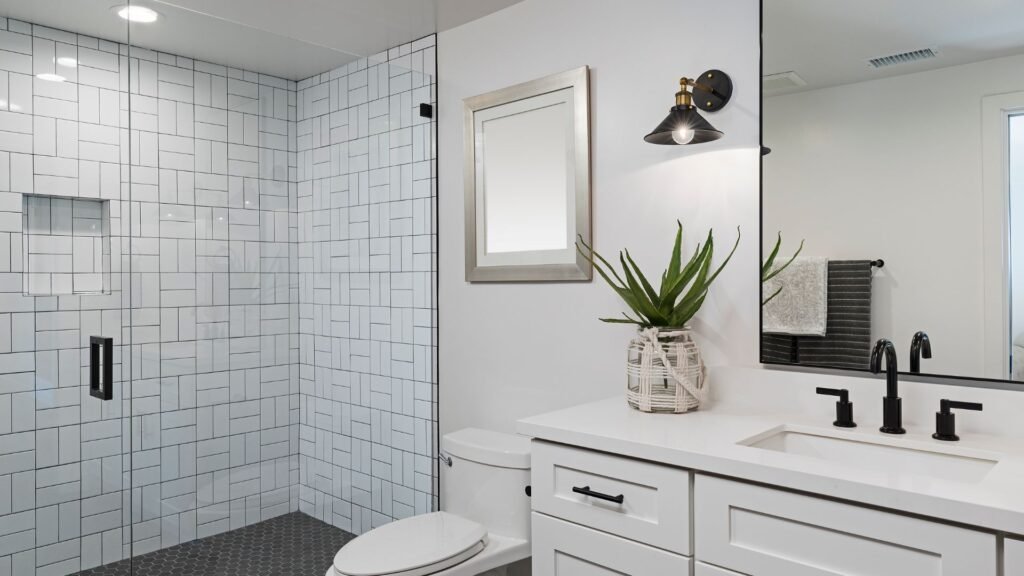
Bigger, safer showers mean more tile, more waterproofing, more plumbing work, and a higher average ticket. That is real growth for a bath specialist, even in a flat market. For design detail, see our guide to universal bathroom design.
Resale Value Still Supports the Spend
The 2025 Cost vs. Value Report put the midrange bathroom remodel at roughly 80% of cost recouped at resale, its strongest showing since 2007. That gives homeowners a defensible reason to commit, and gives your sales team a credible talking point.
The Headwind: Labor, Not Demand
Demand is not the main limit on bathroom remodeling growth. Capacity is. Associated Builders and Contractors estimates construction needs about 349,000 net new workers in 2026 and 456,000 in 2027.
PHCC reports that roughly half of plumbing and HVAC employers struggle to find skilled applicants. Bathrooms depend heavily on plumbers and tile setters, two of the tightest trades.
The practical result is simple. A bath remodeler with a reliable plumber, a trained tile crew, and a predictable schedule can grow even when total spending is flat, because competitors are turning work away or running jobs long.
Common Misconceptions: Myth vs. Reality
| Myth | Reality |
|---|---|
| “The remodeling boom is over, so bath demand is shrinking.” | Total spending has flattened, but bathrooms remain the most common pro project, and pro-led K&B spending is still growing faster than the market. |
| “Rising revenue means the business is growing.” | NKBA notes inflation is carrying much of the industry’s revenue. Track jobs completed and gross profit per crew-week, not just top-line sales. |
| “Aging-in-place is a small specialty market.” | Most renovating homeowners now plan for special needs, and low-curb showers show up in more than half of aging-in-place projects. It is core scope. |
| “Higher interest rates kill bathroom projects.” | Rates discourage moving, which pushes owners to improve the home they have. Most bath projects are also small enough to fund from savings or short-term financing. |
| “More leads will fix slow growth.” | In a capacity-constrained market, close rate, average ticket, and crew throughput usually move revenue more than lead volume does. |
| “Sun Belt markets are where all the growth is.” | Population growth favors the Sun Belt, but the oldest housing stock, and the most deferred bathroom replacement, sits in the Northeast and Midwest. |
The Share-Capture Framework: How to Grow in a Flat Market
Revenue for a bath remodeler is a simple equation. Use it to decide where to push.
Revenue = Qualified Leads × Close Rate × Average Ticket
…limited by crew capacity (jobs per crew per year)
When the market is growing fast, leads rise on their own. When it is flat, the other three levers do the work. Here is a step-by-step way to apply them.
Step 1: Benchmark Your Own Numbers
- Pull the last 12 months of leads, signed jobs, and completed revenue.
- Calculate close rate (signed ÷ qualified leads) and average ticket (revenue ÷ jobs).
- Calculate jobs per crew per year and average days from demo to final.
- Compare gross margin by job type (tub-to-shower, small hall bath, primary suite).
If your pricing math is shaky, start with our professional guide to bathroom estimating, markup, and margin before changing anything else.
Step 2: Package the Growth Segments
Turn the strongest demand signals into named, fixed-scope offers. Packages close faster than open-ended custom bids and make your schedule more predictable.
- Safe Shower package: tub-to-shower conversion, low-curb or curbless entry, grab bars with blocking, nonslip tile, thermostatic valve.
- Future-Ready Primary Bath: enlarged shower, bench, handheld spray, wider doorway, layered lighting.
- Hall Bath Refresh: vanity, toilet, flooring, and fixtures with no plumbing moves, built for speed.
Step 3: Raise the Ticket With Pre-Wire and Pre-Block Options
Most homeowners planning for future needs do not want a hospital-looking bathroom today. Offer invisible future-proofing: wall blocking for later grab bars, a wider shower entry, and electrical for a heated floor or smart toilet.
These options are low-cost during demo and expensive later, which makes them easy to sell honestly.
Step 4: Shorten the Sales Cycle With Transparent Pricing
Homeowners now arrive with a number in mind. Point prospects to the Bath Calculator bathroom remodel cost calculator or the full set of bathroom cost calculators before your first visit, so expectations match reality and you spend less time on mismatched leads.
For buyers who hesitate on price, a financing walk-through helps. Our bathroom remodel financing calculator compares HELOCs, personal loans, and contractor financing side by side.
Step 5: Protect Capacity Before You Add Leads
- Lock in your plumber and tile setter with guaranteed volume or retainer terms.
- Pre-order long-lead items (glass, custom vanities) at contract signing.
- Train a helper into an apprentice tile setter; a second setter often adds more jobs than a second salesperson.
- Only then increase marketing spend.
Step 6: Measure Monthly, Not Annually
Track close rate, average ticket, jobs per crew, and gross profit per crew-week every month. Recheck against the next LIRA and NAHB RMI releases so your plan follows the market, not last year’s assumptions.
Comparing Growth Strategies for Bath Contractors
| Strategy | Demand Signal | Ticket Size | Labor Intensity | Best Fit |
|---|---|---|---|---|
| Aging-in-place specialist | Strong and rising | Mid | Moderate (tile, plumbing, blocking) | Older housing markets, retiree-heavy areas |
| Design-build primary suites | Steady; tickets rising | High | High (multiple trades, long timelines) | Affluent suburbs, firms with design staff |
| Fast tub-to-shower / acrylic systems | Strong | Low to mid | Low (1–3 day installs) | Firms short on tile setters |
| Small-bath volume remodels | Steady; price-sensitive | Low to mid | Moderate | Starter-home and investor markets |
| Investor / rental turnovers | Variable | Low | Low to moderate | Filling schedule gaps, not core growth |
Real-World Scenario: Growing 24% Without More Leads
Consider a hypothetical six-person bath remodeler in a mid-size metro with mostly 1970s and 1980s housing. Last year it received 160 qualified leads, closed 25%, and completed 40 jobs at an average of $24,000.
Baseline revenue: 40 jobs × $24,000 = $960,000.
Going into 2027, the owner assumes lead volume stays flat, in line with the LIRA forecast. Instead of buying more leads, the company makes four changes:
- Launches a fixed-scope Safe Shower package and a Future-Ready Primary Bath package.
- Sends every prospect a calculator link before the in-home visit to pre-qualify budgets.
- Adds blocking, wider shower entries, and heated-floor wiring as standard line-item options.
- Trains a helper into a second tile setter so the schedule can absorb more jobs.
Close rate rises from 25% to 28%, and the average ticket rises from $24,000 to $26,500 as more jobs include enlarged showers and accessibility features.
New revenue: 45 jobs × $26,500 = $1,192,500, an increase of about 24% on the same 160 leads.
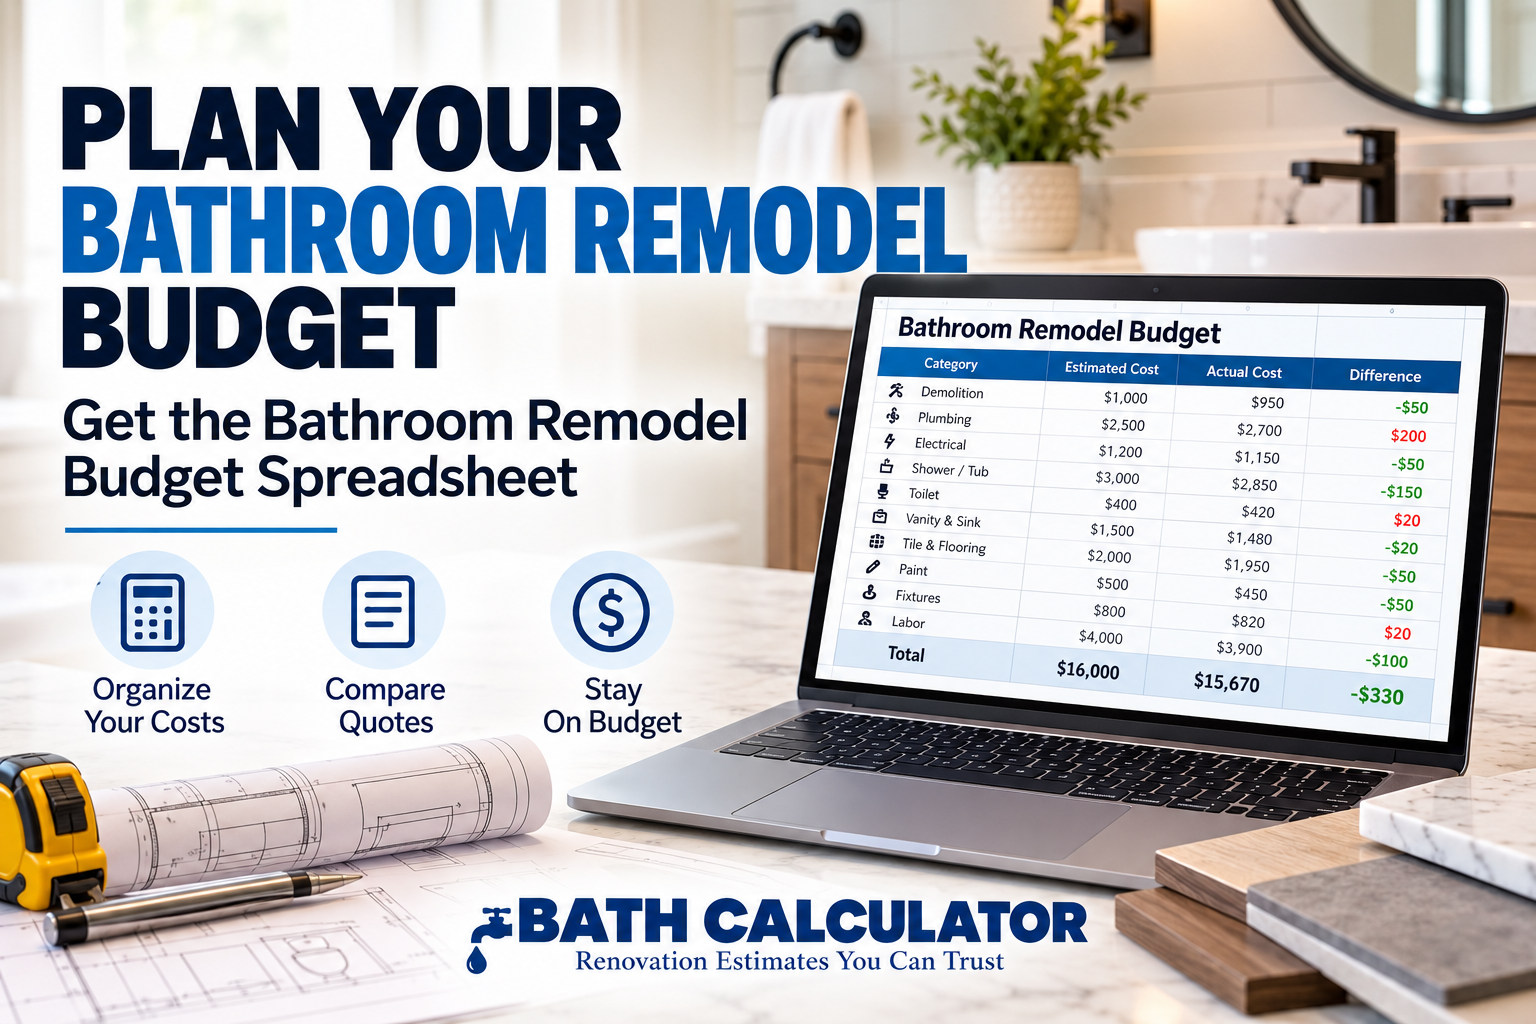
The market did not grow. The company’s share of it did. Run your own version of this math using the free bathroom remodel budget spreadsheet to model ticket sizes by package.
What to Watch Through 2027
- October 22, 2026 LIRA release: confirms or revises the near-flat spending path.
- NAHB Remodeling Market Index: a drop below 50 would signal more remodelers seeing poor conditions than good.
- Mortgage rates and home sales: lower rates could revive move-in and pre-sale bathroom projects.
- Material pricing and tariffs: watch tile, vanities, and fixtures, where imported products can swing bids quickly.
- Trade labor availability: plumber and tile setter wages are an early warning for margin pressure.
Summary
The bathroom remodeling industry is not booming, but it is far from shrinking. Total remodeling spending is flat, while bathrooms keep their spot as the most common professional project and average tickets climb on the back of larger showers, aging-in-place features, and an aging housing stock.
Growth in 2026 and 2027 belongs to contractors who treat it as a share game: package the high-demand scopes, raise the ticket honestly, shorten the sales cycle with transparent pricing, and protect labor capacity before chasing more leads.
Over to you: Which lever is moving your bath business most this year: lead volume, close rate, average ticket, or crew capacity? Share what you’re seeing in your market in the comments below.
Sources: Harvard Joint Center for Housing Studies (LIRA, July 2026); NAHB Eye on Housing and Remodeling Market Index; NKBA 2026 Kitchen & Bath Industry Outlook and Mid-Year Update; 2026 U.S. Houzz & Home Study; Houzz 2026 U.S. Bathroom Trends Study; NKBA 2026 Bath Trends Report; Remodeling 2025 Cost vs. Value Report; Associated Builders and Contractors; PHCC 2026 Environmental Scan. The contractor scenario is hypothetical and for illustration only.